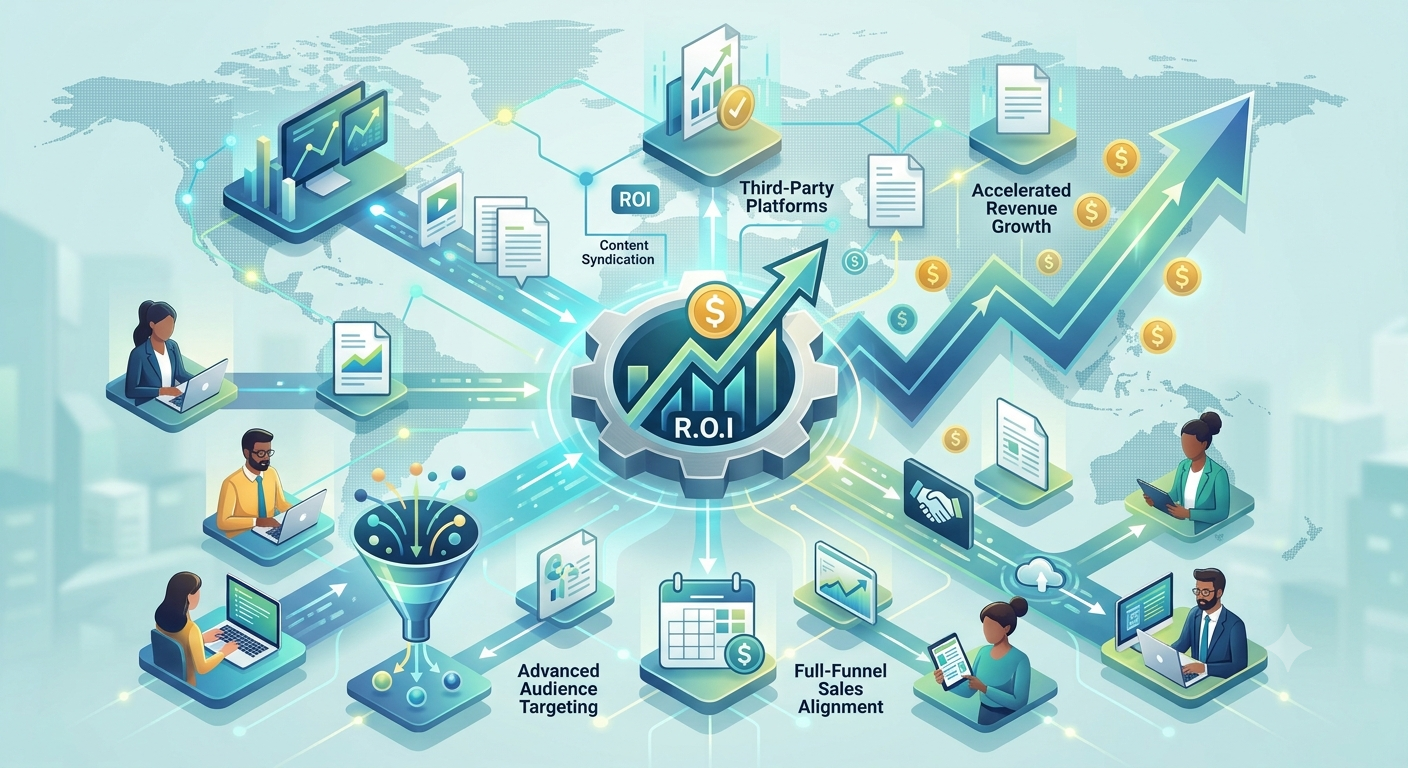


Revenue teams do not fail because individual departments lack talent. They fail when marketing, sales, and customer success measure success differently, use disconnected data, and optimize for goals that do not connect to revenue growth.
The metrics that unite revenue teams create a shared language across the entire buyer journey. They help every team understand what is working, where friction exists, and which actions move prospects closer to becoming loyal customers. Revenue operations, or RevOps, aligns sales, marketing, and customer success around shared data, processes, and goals to drive predictable revenue growth.
For B2B organizations, this alignment is no longer optional. Buyers move across channels, research independently, engage with sales later, and expect a consistent experience from first touch to renewal. A unified metrics framework helps teams remove silos, improve forecasting, and make smarter investment decisions.
This article explains the most important revenue team metrics, how to use them together, and how to build a reporting system that supports sustainable growth.
Why Unified Metrics Matter
Marketing may celebrate lead volume, sales may focus on closed deals, and customer success may track renewals. Each metric is useful, but none tells the complete revenue story on its own.
A unified metrics framework connects the full funnel:
- Marketing generates awareness, demand, and qualified pipeline.
- Sales converts opportunities into revenue.
- Customer success protects revenue, expands accounts, and drives retention.
- Revenue operations connects data, systems, and reporting across all teams.
Revenue operations is an end-to-end model that unifies customer engagement across functions by integrating people, processes, and technology. When teams use the same definitions, dashboards, and revenue targets, they can identify bottlenecks faster and act with greater confidence.
For example, if marketing reports strong lead volume but sales says the leads are not qualified, the issue may lie in lead scoring, ICP definition, or handoff criteria. Unified metrics make that conversation factual rather than emotional.
Start With Shared Revenue Definitions
Before selecting metrics, revenue teams must agree on definitions. A “qualified lead,” “pipeline,” “closed-won deal,” or “marketing-sourced revenue” should mean the same thing to every department.
Without shared definitions, teams can look at the same dashboard and reach different conclusions. This creates mistrust and slows decision-making.
Define the Core Funnel Stages
A simple shared funnel may include:
- Visitor
- Lead
- Marketing qualified lead, or MQL
- Sales qualified lead, or SQL
- Opportunity
- Closed-won customer
- Renewed or expanded customer
Each stage should have clear entry and exit criteria. For instance, an MQL should not simply be someone who downloaded an ebook. It should meet firmographic criteria, show buying intent, and demonstrate behavior that indicates sales readiness.
Assign Metric Ownership
Every metric needs an owner, even if multiple teams influence it. Ownership does not mean one department works alone. It means one team is accountable for improving the result.
| Metric | Primary Owner | Shared Responsibility |
|---|---|---|
| MQL volume | Marketing | Sales, RevOps |
| MQL to SQL conversion rate | Marketing and Sales | RevOps |
| Pipeline coverage | Sales | Marketing, RevOps |
| Win rate | Sales | Marketing, Enablement |
| Net revenue retention | Customer Success | Sales, Product, RevOps |
| Customer acquisition cost | Finance and Marketing | Sales, RevOps |
Clear ownership prevents important metrics from being ignored. It also makes performance reviews more productive because teams know who to involve when a number changes.
Pipeline Metrics That Connect Marketing and Sales
Pipeline is where marketing and sales alignment becomes visible. These metrics show whether demand generation efforts are producing opportunities that sales can realistically close.
Marketing-Sourced Pipeline
Marketing-sourced pipeline measures the value of opportunities created directly by marketing activity. This includes inbound content, paid campaigns, webinars, events, email programs, and organic search.
This metric matters because it connects marketing investment to future revenue rather than limiting marketing performance to leads or clicks.
To calculate it:
Marketing-Sourced Pipeline=Total Value of Opportunities Created by Marketing
Marketing-sourced pipeline should be reviewed by campaign, channel, segment, and persona. This helps teams identify which programs create the highest-quality opportunities.
Marketing-Influenced Pipeline
Marketing-influenced pipeline includes opportunities where marketing touched the buyer at any point before the deal was created. This may include a content download, email engagement, webinar attendance, or website visit.
Influenced pipeline should not replace sourced pipeline. Instead, it provides context. It shows how marketing supports deals even when it does not create the first touch.
Pipeline Coverage Ratio
Pipeline coverage compares open qualified pipeline to the revenue target. It helps sales and finance understand whether there is enough opportunity in the pipeline to achieve the goal.
A common benchmark is three to four times quota, though the right ratio depends on win rate, deal size, and sales cycle length.
For example, if a team needs to close $1 million in new revenue and historically closes 25 percent of qualified pipeline, it may need approximately $4 million in qualified pipeline.
Pipeline coverage should be reviewed weekly or biweekly. It is one of the strongest early indicators of future revenue performance.
Pipeline Velocity
Pipeline velocity measures how quickly qualified opportunities move through the sales process. It combines four factors:
Pipeline Velocity=Sales Cycle LengthNumber of Opportunities×Average Deal Size×Win Rate
Pipeline velocity highlights bottlenecks that prevent qualified leads from becoming closed-won deals. If deal value and win rate remain stable but velocity drops, the team should examine stages where opportunities stall.
Common causes include unclear qualification, slow follow-up, weak business cases, missing stakeholder access, or lengthy procurement processes.
Lead Quality Metrics That Improve Handoffs
Lead volume alone can create false confidence. A high number of leads means little if sales cannot convert them into opportunities. These metrics help marketing and sales evaluate lead quality together.
MQL to SQL Conversion Rate
The MQL to SQL conversion rate measures the percentage of marketing qualified leads that sales accepts and converts into sales qualified leads.
MQL to SQL Rate=MQLs DeliveredSQLs Created×100
A low conversion rate may indicate poor targeting, weak lead scoring, incomplete lead data, or a misalignment between marketing and sales qualification criteria.
This metric should be reviewed by source, campaign, industry, company size, and persona. It is especially useful for identifying which demand generation programs produce buyers rather than just form fills.
SQL to Opportunity Rate
The SQL to opportunity rate shows how many sales qualified leads become real opportunities. It helps determine whether sales development and account executive qualification processes are effective.
If many SQLs fail to become opportunities, the team should review discovery calls, ideal customer profile fit, intent signals, and follow-up cadence.
Lead Response Time
Lead response time measures how quickly sales follows up with a new lead. Speed matters because buyer interest can fade quickly, especially in competitive B2B markets.
Track response time by lead source, campaign, and rep. If certain channels produce leads that are contacted quickly while others sit untouched, workflow automation or routing rules may need improvement.
Sales Accepted Lead Rate
The sales accepted lead rate measures the percentage of marketing leads that sales agrees to work. It is a direct measure of trust between marketing and sales.
A low acceptance rate is not automatically a marketing problem. It may reveal unclear handoff rules, insufficient lead context, outdated contact data, or a mismatch between campaign targeting and the sales team’s territory or ICP.
Sales Effectiveness Metrics That Drive Forecast Accuracy
Sales metrics reveal whether the team can convert pipeline into revenue efficiently. They also expose coaching opportunities and process gaps.
Win Rate
Win rate measures the percentage of opportunities that result in closed-won deals.
Win Rate=Total Closed OpportunitiesClosed-Won Opportunities×100
Win rate reflects overall sales effectiveness and is a key signal of deal quality, competitive positioning, and sales execution.
Break win rate down by segment, deal size, industry, competitor, sales rep, and lead source. This prevents a strong average from hiding weaknesses in specific markets or motions.
Average Sales Cycle Length
Sales cycle length measures the average number of days from opportunity creation to closed-won or closed-lost. It reveals friction in the pipeline and helps teams forecast more accurately.
A long sales cycle is not always bad, especially for enterprise deals. However, an increasing cycle length without a corresponding increase in deal size may signal poor qualification, unclear decision-making, or weak stakeholder engagement.
Average Deal Size
Average deal size shows the typical revenue value of closed-won opportunities. It helps revenue leaders understand whether growth is coming from more deals, larger deals, or both.
Monitor average deal size by product line, customer segment, and sales motion. If deal size is shrinking, marketing may be attracting smaller accounts, or sales may need stronger value-based selling support.
Forecast Accuracy
Forecast accuracy compares projected revenue with actual closed revenue. It is one of the most important executive-level revenue metrics because it affects hiring, spending, board reporting, and growth planning.
Improve forecast accuracy by using consistent stage definitions, requiring next steps in every opportunity, and reviewing pipeline hygiene regularly.
Customer Acquisition and Efficiency Metrics
Revenue growth is not only about winning more customers. It is also about acquiring them efficiently. These metrics help marketing, sales, finance, and leadership evaluate the true cost of growth.
Customer Acquisition Cost
Customer acquisition cost, or CAC, measures the total cost of acquiring a new customer. It typically includes marketing spend, sales salaries, software, agencies, and other acquisition-related costs.
CAC=Number of New Customers AcquiredTotal Sales and Marketing Cost
CAC should be tracked by channel, campaign, segment, and acquisition motion. This helps teams identify the most efficient sources of revenue growth.
CAC Payback Period
CAC payback period measures how long it takes to recover the cost of acquiring a customer. Shorter payback periods improve cash flow and make growth more sustainable.
This metric is especially important for subscription businesses and companies investing heavily in paid acquisition.
Customer Lifetime Value
Customer lifetime value, or CLV, estimates the total revenue a customer generates over the course of the relationship. It helps teams determine whether acquisition costs are justified.
CLV to CAC Ratio=Customer Acquisition CostCustomer Lifetime Value
A healthy CLV to CAC ratio suggests that the business acquires customers profitably. However, teams should also examine margin, retention, expansion revenue, and payback period before drawing conclusions.
Retention Metrics That Protect Revenue
Customer success is a revenue function, not a post-sale support function. Retention metrics show whether the business can keep and grow the revenue it has already won.
Net Revenue Retention
Net revenue retention, or NRR, measures recurring revenue from existing customers after accounting for churn, downgrades, upgrades, and expansion.
NRR=Starting RevenueStarting Revenue+Expansion−Contraction−Churn×100
NRR is one of the clearest indicators of long-term revenue health. Strong NRR means existing customers are becoming more valuable over time.
Gross Revenue Retention
Gross revenue retention measures revenue retained before expansion. It isolates churn and downgrade risk.
This metric is useful because expansion can sometimes mask retention problems. A company may show strong NRR while losing a concerning number of smaller customers.
Churn Rate
Churn rate measures the percentage of customers or revenue lost during a period. It is a key signal of post-sale customer health.
Track both logo churn and revenue churn. Logo churn shows how many customers leave, while revenue churn shows how much revenue is lost.
Expansion Revenue
Expansion revenue includes upsells, cross-sells, seat growth, and product upgrades. It shows whether customer success, product, and sales teams are creating additional value after the initial purchase.
Expansion revenue should be connected to account health, product usage, support activity, and customer engagement data.
Data Quality Metrics That Support Every Team
Revenue metrics are only reliable when the underlying data is accurate. Poor data quality leads to bad routing, weak personalization, inaccurate reporting, and wasted sales effort.
Contact and Account Completeness
Measure the percentage of records with complete and accurate fields, such as:
- Company name
- Industry
- Employee size
- Job title
- Email address
- Phone number
- Geographic region
- Buying committee role
Accurate firmographic and demographic attributes improve targeting and help teams identify the right prospects. The Lead Crafters emphasizes defining the ICP and target audience, then incorporating demographic, firmographic, and behavioral attributes to support precision targeting.
Duplicate Rate
Duplicate records create confusion, inflate reporting, and damage customer experience. Track duplicate contacts, duplicate accounts, and duplicate opportunities.
Data Decay Rate
Contact data decays as people change jobs, companies reorganize, phone numbers change, and organizations merge. Monitor the percentage of records that become invalid or outdated over time.
Email Deliverability and Engagement
Email deliverability, bounce rate, open rate, click rate, and reply rate help teams understand whether their outreach reaches real, engaged buyers. These metrics also protect domain reputation and improve future campaign performance.
Building a Unified Revenue Dashboard
A unified dashboard should not include every possible metric. It should highlight the few numbers that help leaders make decisions.
Executive Dashboard
Leaders should monitor:
- New pipeline created
- Pipeline coverage
- Closed-won revenue
- Forecast accuracy
- CAC
- NRR
- Win rate
- Average sales cycle
Marketing Dashboard
Marketing should monitor:
- MQLs
- MQL to SQL conversion rate
- Marketing-sourced pipeline
- Marketing-influenced pipeline
- Cost per MQL
- Campaign pipeline contribution
- Content and channel performance
Sales Dashboard
Sales should monitor:
- SQLs
- Opportunities created
- Pipeline coverage
- Win rate
- Average deal size
- Sales cycle length
- Forecast category movement
- Activity-to-meeting and meeting-to-opportunity conversion
Customer Success Dashboard
Customer success should monitor:
- NRR
- Gross revenue retention
- Churn rate
- Expansion pipeline
- Product adoption
- Account health score
- Renewal risk
- Customer satisfaction
How to Turn Metrics Into Action
Metrics do not create alignment by themselves. Teams must use them in regular operating rhythms.
Hold a Weekly Revenue Meeting
Bring marketing, sales, customer success, and RevOps together to review:
- New pipeline
- Lead handoff performance
- Pipeline coverage
- Stalled opportunities
- Forecast changes
- At-risk accounts
- Data quality issues
Keep the meeting focused on decisions, not just reporting.
Review Metrics by Segment
Company-wide averages can hide important issues. Review performance by:
- Industry
- Company size
- Geography
- Persona
- Deal size
- Lead source
- Sales rep
- Customer cohort
This helps teams identify where to invest, which segments need better messaging, and which parts of the funnel require improvement.
Set Shared Goals
Avoid setting isolated goals such as “marketing must deliver 500 MQLs” or “sales must close 50 deals.” Instead, create shared goals such as:
- Increase qualified pipeline by 25 percent.
- Improve MQL to SQL conversion from 20 percent to 28 percent.
- Reduce sales cycle length by 10 percent.
- Increase NRR from 105 percent to 115 percent.
- Improve forecast accuracy to within 10 percent.
Shared goals encourage collaboration because every team contributes to the same outcome.
Common Metric Mistakes to Avoid
Even strong revenue teams can misuse metrics. Avoid these common mistakes:
- Measuring vanity metrics such as raw lead volume without quality context.
- Using different definitions for MQLs, pipeline, and revenue attribution.
- Celebrating marketing-sourced pipeline without reviewing conversion and win rates.
- Ignoring customer success metrics until renewal time.
- Letting CRM data become outdated or inconsistent.
- Tracking too many metrics without assigning owners.
- Focusing on monthly numbers while ignoring leading indicators.
- Treating attribution as a perfect science rather than a directional decision-making tool.
How The Lead Crafters Supports Revenue Alignment
The Lead Crafters helps B2B and B2C sales and marketing teams modernize campaigns and improve demand generation outcomes. Its approach focuses on understanding customer goals, building tailored strategies, and making ongoing adjustments based on performance feedback.
For revenue teams, this matters because better targeting, cleaner contact data, and campaign insights help marketing and sales work from the same foundation. The company’s quality process verifies contact records and incorporates demographic, firmographic, and behavioral attributes to support precision targeting.
Unified metrics work best when supported by reliable data, clear processes, and actionable insights. The Lead Crafters also provides insights to optimize sales and marketing efforts, including identifying engaged prospects, follow-up priorities, content recommendations, and engagement levels across campaign assets.
Final Thoughts
The metrics that unite revenue teams are not just numbers on a dashboard. They are the shared language that helps marketing, sales, customer success, finance, and operations work toward one goal: profitable and predictable revenue growth.
Start with a small set of shared metrics, define them clearly, assign ownership, and review them consistently. Focus on pipeline quality, conversion efficiency, revenue retention, acquisition cost, and data reliability.
When every team can see how its work affects revenue, alignment stops being a slogan and becomes an operating system. That is how B2B organizations build stronger forecasts, better customer experiences, and sustainable growth.